
Solar Power Blog
The Top Ten Countries Using Solar Power in 2022
As the sun revolves around the globe, more and more countries are generating solar power at small and large scales capacities. And in 2022, the decade-long boom of the international solar energy industry continues to grow.
With geopolitics and supply chain shortages from the coronavirus pandemic limiting the world’s available resources, PV solar power has the potential to domestically generate tons of electricity, anywhere the sun shines. Below, we’ll take a look at which countries are producing the most solar power in 2022.
Which Countries are Producing the Most Solar Power?
First and foremost, we must start by saying that the amount of solar power capacity is always increasing around the world. While this is an exciting notion to combat climate change, it also makes it very hard to quantify the actual amount of power generation in any given country at one time, especially as small-scale and dispersed solar energy continues to grow in popularity.
With that all being said, here are the top ten solar-powered countries in the world today…
China
As the most populous country in the world, China also produces the most solar energy internationally. While only accounting for roughly 3.5% of the country’s total power generation in 2020, solar power in China has grown tremendously year over year since 2011, when government incentives were first introduced.

Able to claim the top spot for both PV and thermal solar energy, China has been producing the most solar electricity worldwide since earning the #1 ranking over Germany in 2015. Produced domestically, China’s solar revolution is largely based on locally made panels.
United States
In North America, it is no secret that the United States is looking to the skies for a sustainable energy grid powered by wind and solar. Although skating by at just 3% of the US’s total electricity generation at the turn of the decade, the EIA projects that solar power could make up as much as 20% of the power grid in 2050.

In the image above, you’ll see solar’s rise in the United States as it gains popularity over other renewable technologies. This is largely due to the fact that solar power is now the cheapest form of electricity ever in the United States when developing new resources.
Japan
Next up, let's head back to Asia and visit the island nation of Japan, where (in the irradiance map below) you’ll see that there is a ton of solar potential in the country’s south from Tokyo and onward. Since the Fukushima Daiichi nuclear disaster in 2011, Japan has been capitalizing on this potential, installing enough solar power to be the 2nd highest capacity producer in the world in 2016.

Alongside a feed-in tariff and other government subsidies, Japan’s small-scale solar power generation has been accelerating since 2008. However, it has been the country’s large PV power plant projects that have allowed Japan to become a world leader in the industry since the launch of the Solar Ark in 2002.
Germany
Flying to the next continent over, Germany has been Europe’s leader in solar power since the turn of the millennium. With the second-most PV solar capacity per capita installed in the world, Germany surpassed the 50,000 MW mark in 2020. As the former world leader in total installed capacity, information from this 2016 fact sheet below shows exactly how the country managed to become so prolific in the industry.
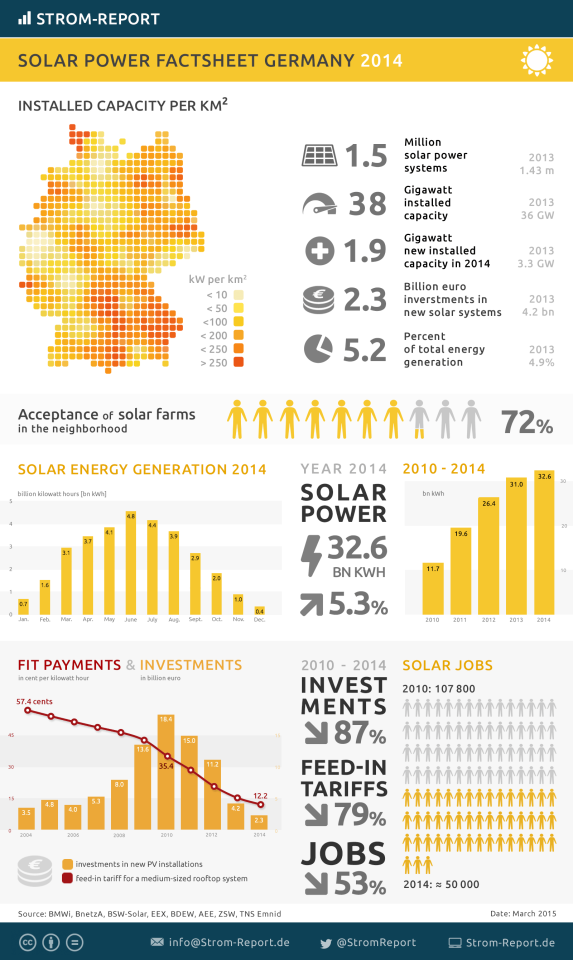
Looking forward, Germany hopes to be powered by 80% renewable energy in 2050, with significant production from PV solar. While feed-in tariffs are slowly losing their value, the country continues its acceleration towards a larger renewable grid with high-capacity projects throughout its cities and rural areas.
India
As the second-most populous country that may be well on its way to the number one spot, India has tremendously grown its solar power footprint in the last 5 years. Although it hoped to achieve 20 GW capacity of solar installation by 2022, India actually managed to hit that target four years early.

Data from https://www.renewablesindia.in/
With over 300 clear and sunny days per year, India can capitalize on great conditions for generating solar power all over the country. Currently, it is operating and rapidly developing tons of large-scale projects for both PV and thermal solar energy.
Italy
Next, Italy is currently Europe’s second-largest producer of solar power and was once the world’s #1 in 2013. After being motivated by the effects of climate change since the 1990s, Italy has long been one of the most powerful voices for new international solar energy development.

With eyes on the Mediterranean Sea to host a floating super grid, Italy is in a great position geographically and politically to become a local leader in the future of solar. Hoping to reach 52 GW of domestically installed PV capacity by 2030, Italy continues to be one of the solar industry’s strongest players.
United Kingdom
Although most will picture the UK as a cloudy, gray landscape, this hasn’t stopped Great Britain and Northern Ireland from producing roughly 4% of their total energy with PV solar panels in 2022. Across England, Wales, Scotland, and beyond, both the government and private citizens in the UK have been strategically developing new solar farms since 2010, when feed-in tariffs were introduced.

Although truly limited in total potential, solar power still plays a strong role in the future of a greener United Kingdom. Despite the fact that new PV capacity has slowed significantly since the COVID-19 pandemic, the UK still hopes to achieve its goal of 100% renewable sources by 2035.
Australia
Down Under, Australia has the most PV solar per capita installed in the world with over 3 million independently operating sites. With a huge majority of the country’s materials coming from China to the north, Australia’s solar potential is unmatched. Looking at the irradiance data below, you’ll see that the continent is practically built for solar power.
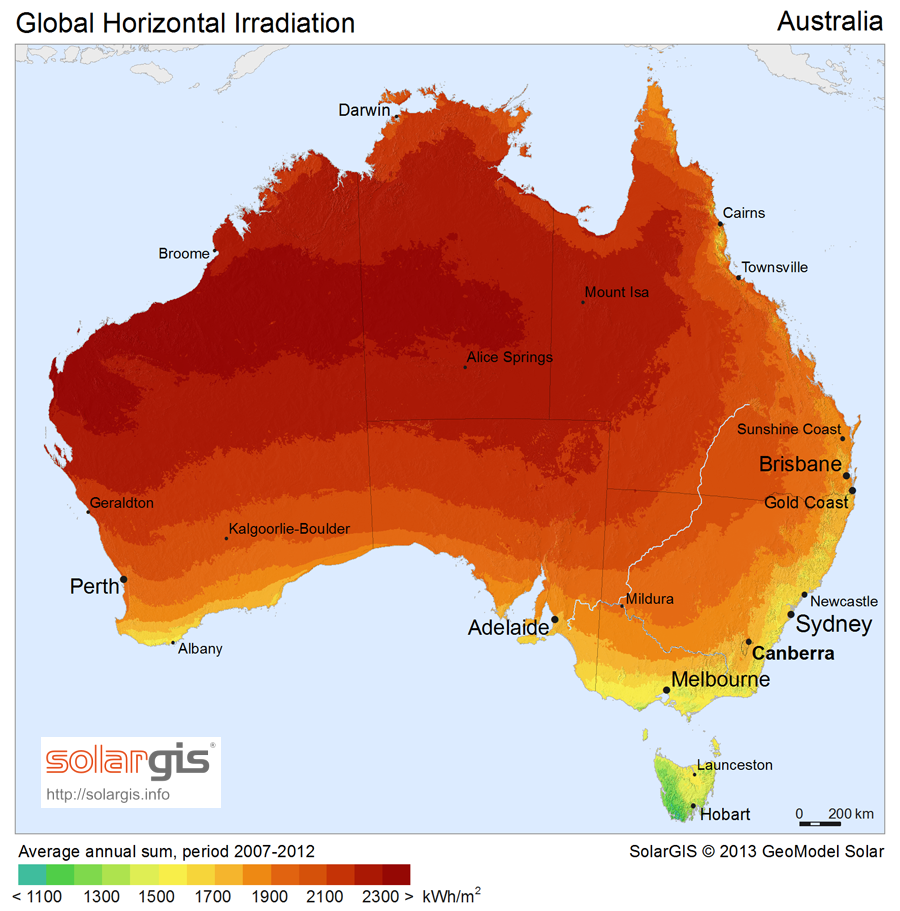
So what’s stopping Australia from 100% solar power? Unfortunately, the vast majority of the country's population lives in the coastal cities with the least amount of solar potential. Even so, Australia's numerous solar farms and PV power plants are helping cities like Sydney achieve their ambitious goals of 100% renewable energy by 2030.
France
Home of Europe's largest floating PV module (as pictured below), France is another world leader in solar power development. Although the technology has had mixed political support over the last decade, both large-scale and residential solar power in France have been slowly rising in total installed capacity.
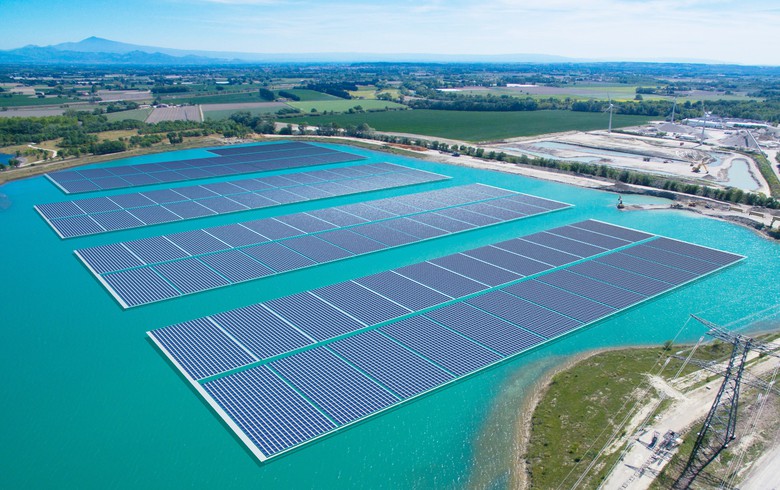
Recently announcing a 100 GW target by 2050, France has now officially set its first solar power goal and is on pace to get there with 5 GW of new PV capacity installed each year. So while slow to reach its current position in the world’s rankings, France is certainly one of the most exciting countries to watch in the next decade of solar power.
South Korea
And finally, South Korea earns the last spot in our list of the top ten solar-powered countries around the world. Deploying 4.1 GW of solar in 2020 and even more in 2021, the country is aiming to develop 30.8 GW of new solar power capacity by 2030 alongside 16.5 GW of new wind power.
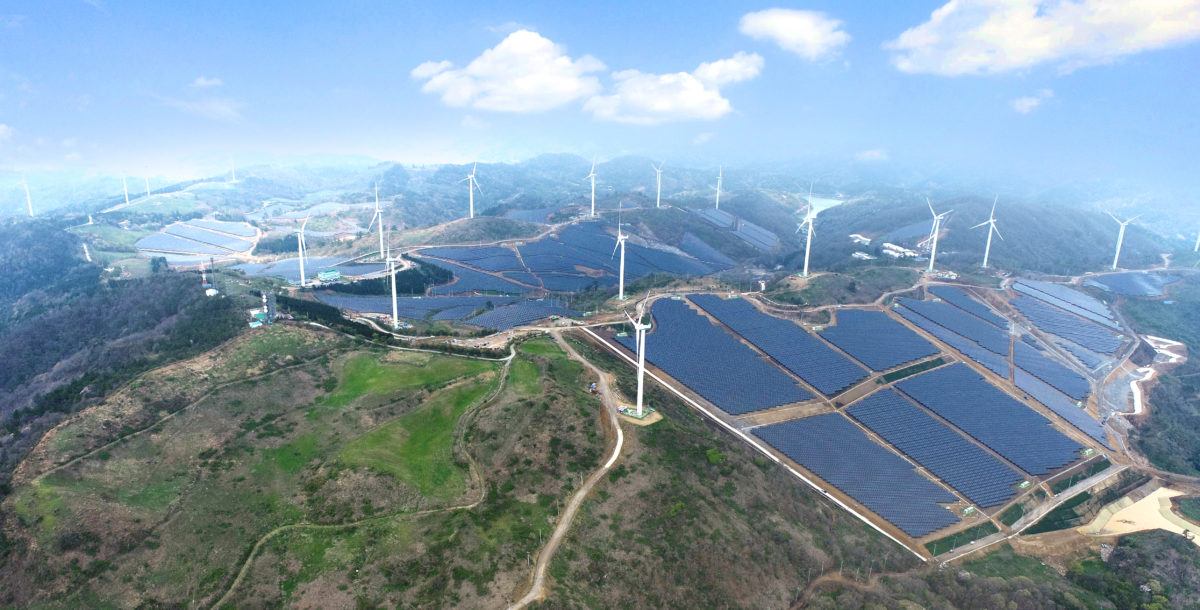
As a country largely dependent on imported oil and natural gas, South Korea’s electrification and renewable energy development are helping it become a more sustainably powered country overall. While previously focused on nuclear, South Korea is now working to decommission its coal and alternative power plants to focus on new solar and wind development.
For more information on solar power and renewable energy, feel free to check out all of the articles in the Solar Us Shop blog.
Charles Gross says...
Although I appreciate the information you provide, I’m somewhat frustrated with the format you chose. I expected a table starting with China (#1) and ending with South Korea (#10), each with its installed solar capacity (GW) and latest date (2021, etc), simple to copy and reference. W per capita would be nice as well.
On July 19, 2023